- The user can specify control limits on measurements. Measurements that are out of spec in the results are highlighted.
- Graphing results is easy. Visibly see correlations between one measurement and another. With DiscTrack Plus’ flexible analysis package you can quickly hunt down critical parameters and recognize their effects:
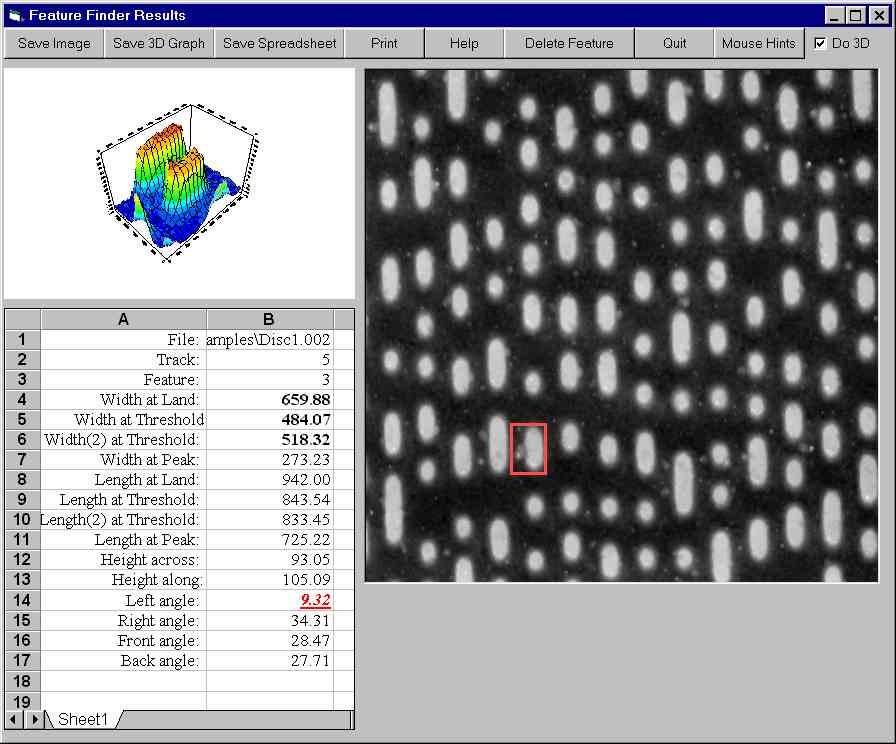
- Our unique FeatureFinderTM, a sophisticated tool for data inspection, lets you instantly find the defects that cause measurements to be out of specification. With a double click on a graph point…
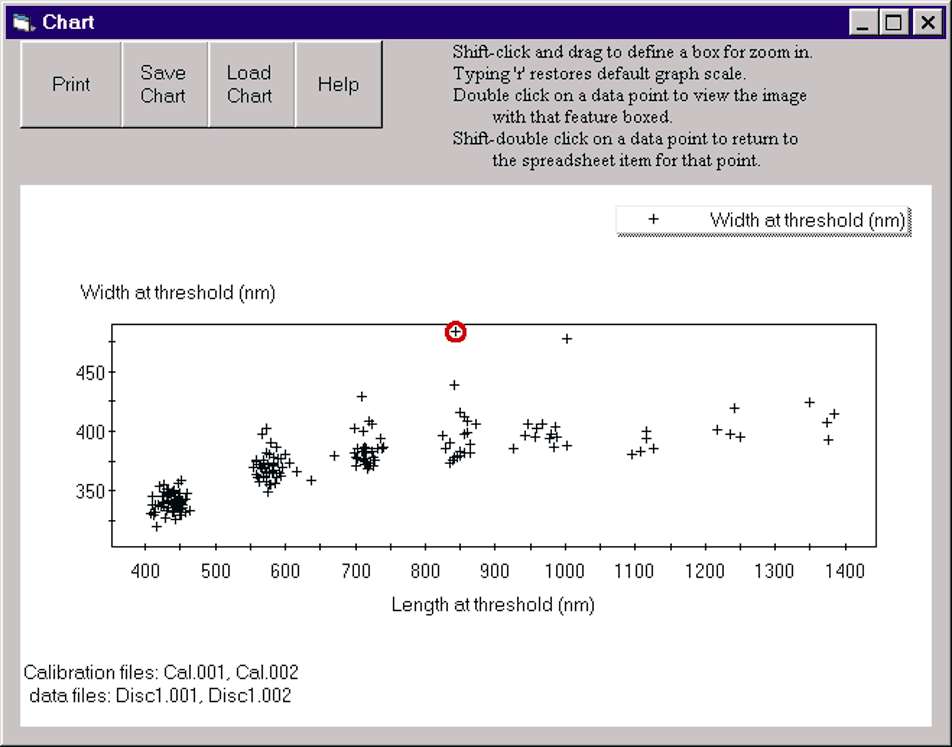
…the software displays the image with the feature highlighted, along with a three dimensional view of the feature and all the measurements of the feature highlighted
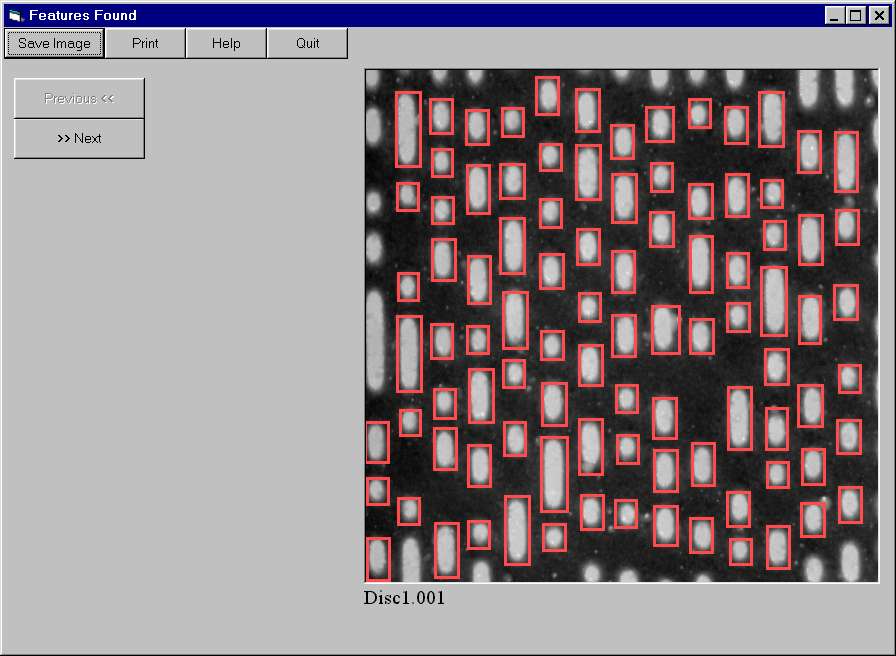
- Identify all the features measured:
- Automatically convert variation in feature length into its jitter equivalent:
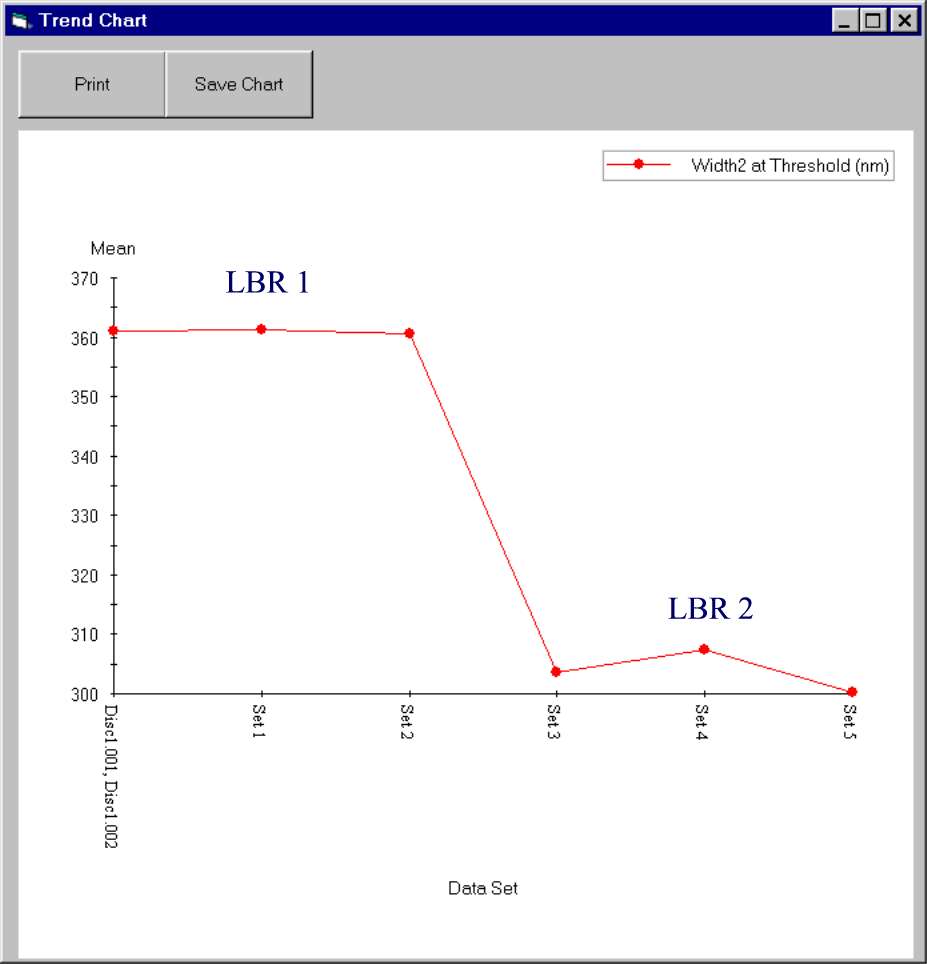
- Record trends:
 And graph them: