Phase Imaging and Chemical Mapping
What is Phase Imaging?
Phase Imaging is a powerful tool that is sensitive to surface stiffness/softness and adhesion between the tip and surface. It allows chemical mapping of surfaces based on these material differences. It is particularly useful in analyzing polymers, composites, and surface coatings. NanoScope brand AFMs allow capturing both height (topography) and phase data simultaneously allowing surface structure and material domains to be directly compared.
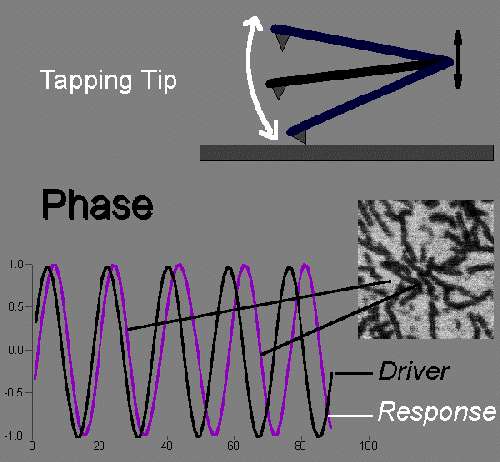
How it works:
A sharp probe is brought into proximity with the specimen surface. The probe is oscillated vertically near its mechanical resonance frequency. As the probe lightly taps the surface, the amplitude of oscillation is reduced and the AFM uses this change in amplitude in order to track the surface topography. In addition to its amplitude, the probe motion can be characterized by its phase relative to a driving oscillator. The phase signal changes when the probe encounters regions of different composition. Phase shifts are registered as bright and dark regions in phase images, comparable to the way height changes are indicated in height images.
Why Are Phase Images Useful?
Phase images often show extraordinary contrast for many composite surfaces of technological and scientific interest. These include contamination deposits, discontinuous (i.e. defective) thin films, devices built of composite materials (e.g. magnetic recording heads), and cross-sectional specimens of composite materials. Both inorganic and organic materials can be examined. We have found that phase imaging is more convenient and gentler than other methods which are based on contact mode operation. It routinely achieves lateral resolution of about 10 nm.
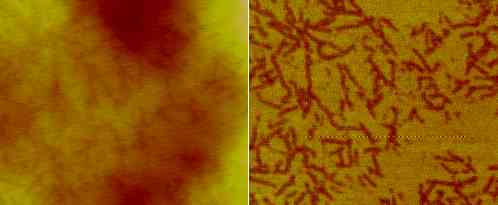
Note the strong contrast between domains in the above image. While the topographic image shows some corresponding features, surface roughness hinders the identification of domains. The phase image allows unambiguous resolution of the different material phases. Field of view = 1×1 um.
(Now you can reproduce these results in your own lab, using the Model PT phase test specimen.)
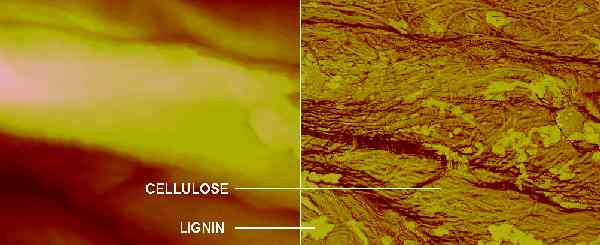
On this wood fiber, thin patches of lignin cover the cellulose microfibrils. We have observed similar chemical contrast in a wide range of material systems, involving both inorganic and organic phases, with lateral resolution of 10 nm. Field of view = 3×3 um. This wood pulp fiber was prepared as follows:
– Wood = Eucalypt
– processing: Kappa 18 MCC cooking, then O2 delignification, Kappa value was 12.
references:
1. Pereira, D. E. D. & Claudio-da-Silva, Jr., E. „Improvement of AFM as an analytical Instrument for Residual Lignin Characterization” in: Proceedings International Symposium on Wood and Pulping Chemistry, Helsinki, Finland, June 1995
2. Pereira , D.E.D., Chernoff, D., Claudio-da-Silva, Jr. E., & Demuner, B. J., “The use of AFM to investigate the delignification process: Part I – AFM performance by differentiating pulping processes”,ATIP magazine, vol 56 number 2, april -Mai 2001. (ATIP is Associassion Technique de la Industrie Papeterie).
[Personal note: with apologies to Helen of Troy (“the face that launched a thousand ships”), DC calls this image “the phase that launched a thousand tips” because it stimulated so much further work, which continues to this day.]