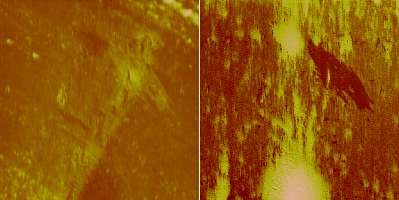
We use Lateral Force Microscopy (LFM) to measure frictional forces resulting from the AFM probe scanning over a sample. When the probe crosses an area of the sample which has a higher friction coefficient, the cantilever will display a greater amount of torque. The opposite is true for areas with lower coefficients of friction. Here ‘high’ and ‘low’ are relative terms, for instance a ‘sticky’ contaminant on glass may have a ‘higher’ coefficient of friction than the surrounding substrate. Thus, the contaminant would appear brighter in the friction image. In the image below, where the contaminant could be said to be ‘slippery’ (having a low friction coefficient), the contaminant appears darker in the friction image.
Contaminant on Glass Substrate
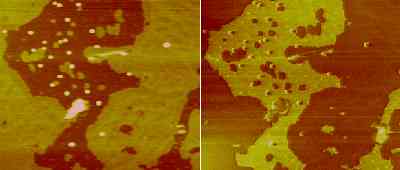
Mixed molecular monolayer (Langmuir-Blodgett thin film on mica)
In-Depth Analysis
The interpretation of observed frictional forces in terms of friction coefficients requires care if numerical results are needed. Recall that the friction coefficient relates the friction force to the normal force. We have developed analytical test procedures that provide a more robust ranking of the friction coefficients of different samples than could be achieved otherwise.