Rk Parameters for AFM inspection of Wear and Surface Finish
When evaluating surface finishing processes and wear phenomena, we find it valuable to examine AFM (Atomic Force Microscope) images showing 3-dimensional surface structure, to calculate Ra (average roughness), Rq (rms roughness) and related roughness parameters from those images, and to graph height histograms and bearing ratio curves.
Sometimes the above information does not give a full understanding of the situation. For example, the Ra values may not correlate well with qualitative surface differences that are obvious from the images. We recently developed software to calculate the Rk parameters from AFM data and to prepare histogram and bearing data for replotting. We are excited about the value of this additional information. It has, for example, allowed us to quantify the dramatic difference between a new and a broken-in wear surface.
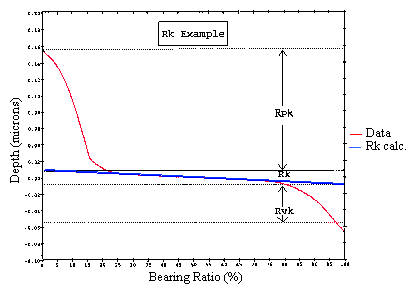
The Rk parameters give a numerical summary of information contained in the bearing ratio curve (Abbott-Firestone Curve), based on a division of the depth scale into three regions (top, or peak region; middle, or core region; bottom, or valley region). See graph below. An example of the interpretation is as follows. When two surfaces rub together, the peak region is worn away during the break-in period, the core region bears the load for the life of the product, and the valley region is available as a lubricant reservoir. Additional parameters estimate the amount of material in each region.

The Rk parameters are not calculated by standard AFM software, Advanced Surface Microscopy uses its own Rk software when preparing analytical reports for its clients.