Important tool for polymer science.
Just as polymers are one of the most important backbones of modern industry, so, too, is AFM an important tool in the engineering and production of polymers. AFM can reveal surface structures at nanometer scales, can map material domains in copolymers and blends, and identify and characterize crystalline and amorphous regions, all of which help determine the properties of the polymer.
Natural polymers
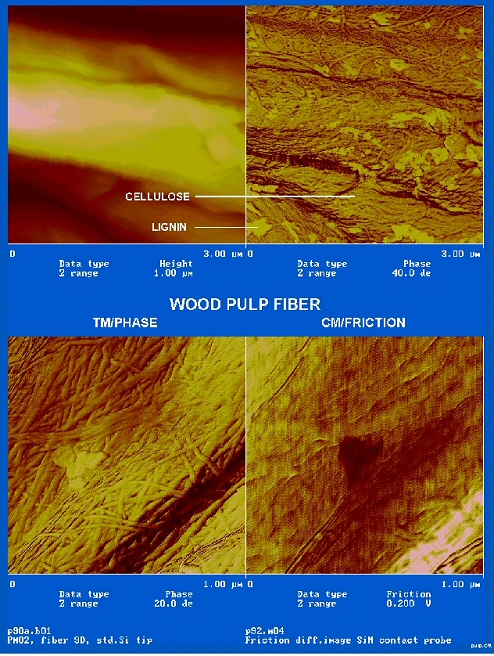
Although most people don’t think of it in those terms, cellulose from plants and keratin from animals are naturally occurring polymers. These form the basis of the natural fibers used in fabric, paper, and many other applications in industry. AFM has been used to better understand these materials and to help make better products.
Wood pulp fibers, for example, primarily consist of two materials, cellulose and lignin. Both are biopolymers found in the cell walls of plant cells. In wood pulp fibers, AFM can be used map regions of lignin and regions of cellulose.
Engineered Polymers
Polyethylene, Polystyrene, Polycarbonate, Nylon, , Teflon, Polyvinyl Chloride, polypropylene, and a host of others are among the commonly used polymers in modern engineering.
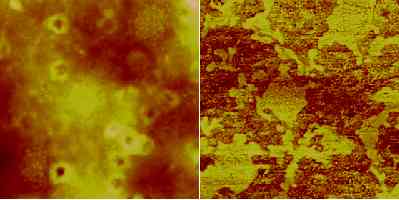
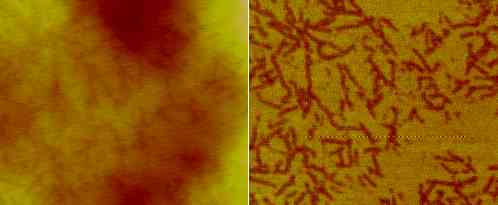
Copolymers and Blends
Atomic Force Microscopy can reveal the structure of copolymers and polymer blends. The use of techniques like phase imaging, which are sensitive to the mechanical properties of materials in the surface, can map material domains.